Singapore residential market · official data to 2Q 2026
Why Singapore home prices keep climbing
Ten years of prices, twenty years of GDP, the forces behind both, and what DBS expects to 2040. Every figure carries its source in brackets; click to open it.
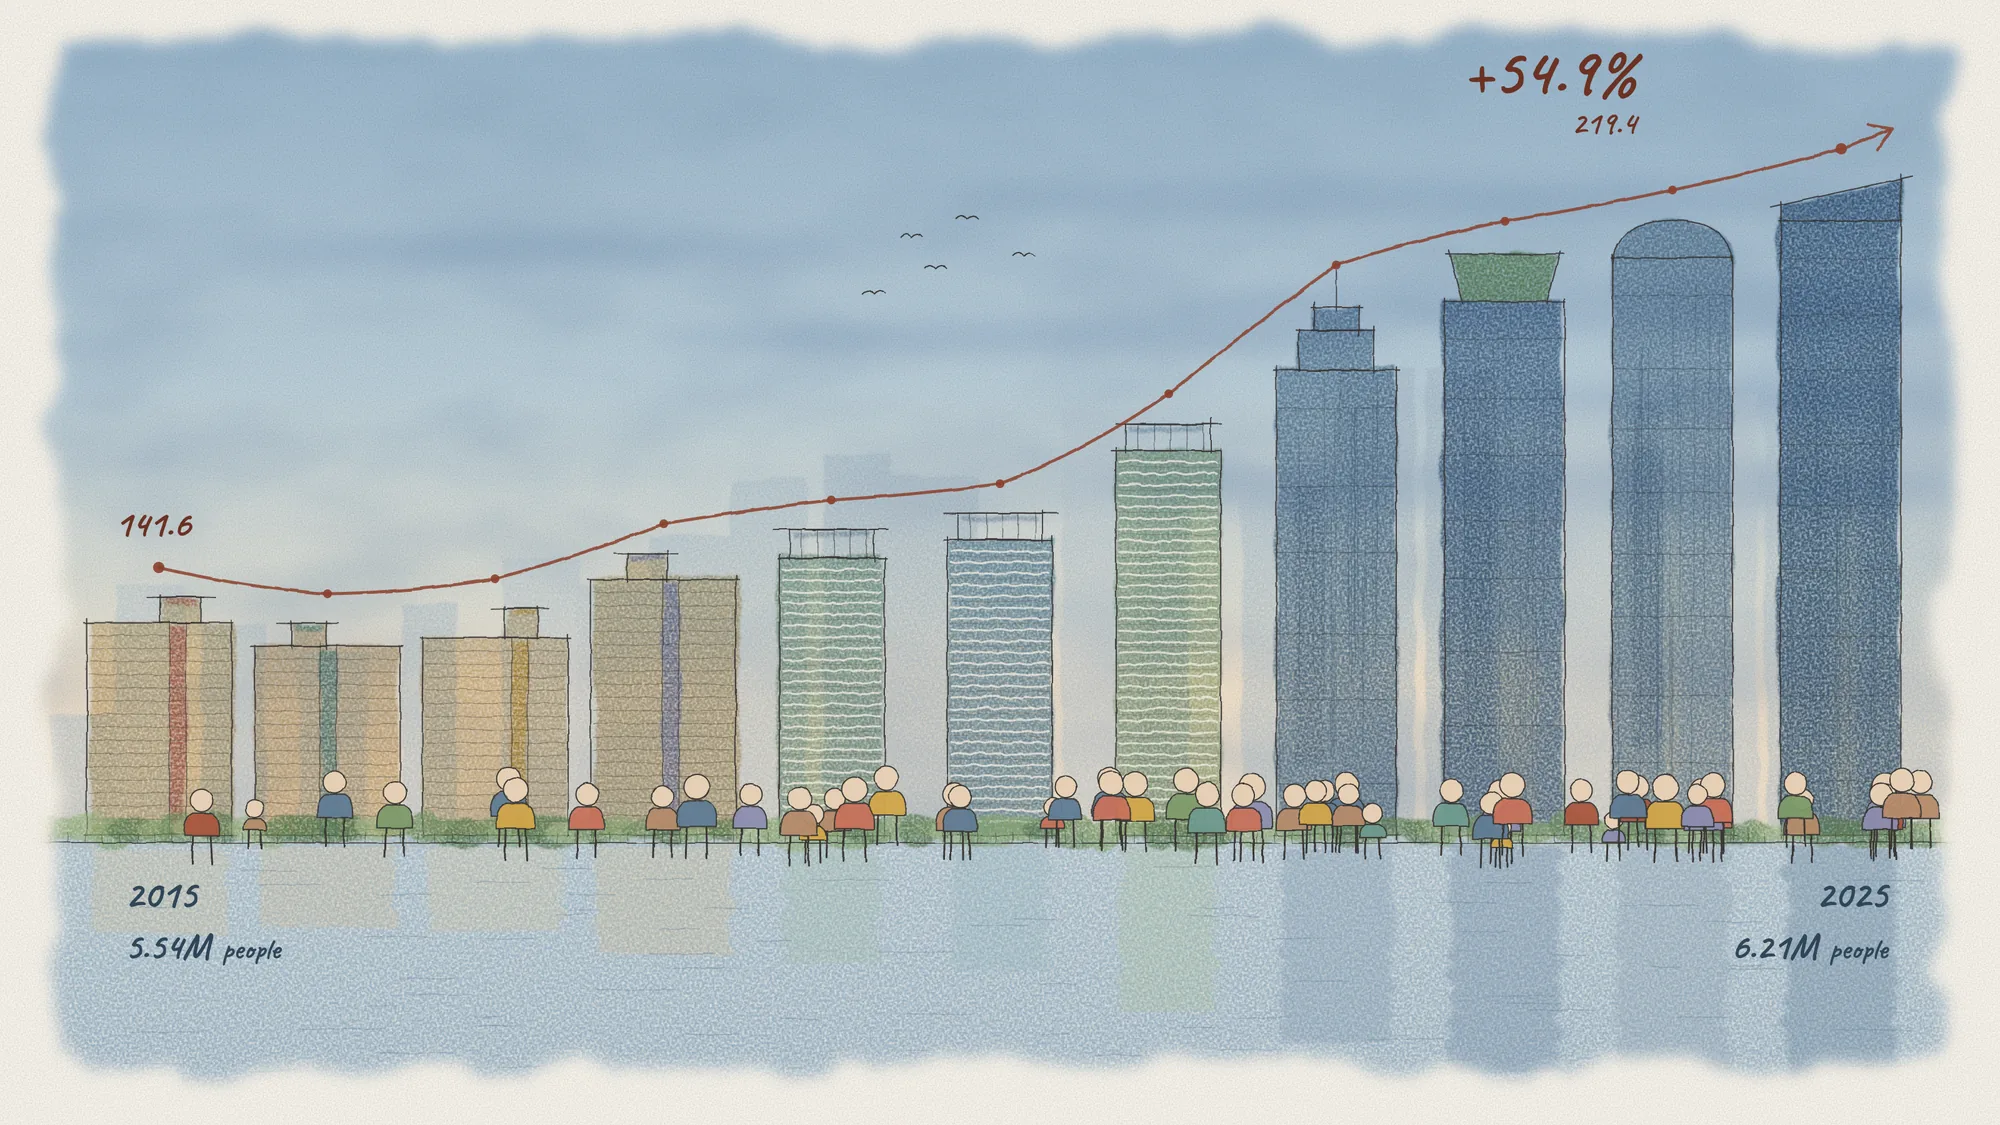
Private home prices and population, 2015 to 2026. The URA index rose from 141.6 at the end of 2015 to 219.4 in 2Q 2026 — up 54.9% — while the population grew from 5.54 million to 6.21 million. The +52.8% in the panel below is the same index measured to the end of 2025, which is the last full year.
Private home prices+52.8%URA price index 141.6 → 216.4, 4Q 2015 to 4Q 2025Source: URA via SingStat
URA's private residential price index finished 2025 at 216.4 (1Q 2009 = 100), up from 141.6 at the end of 2015URA via SingStat. It rose every year since 2017 and added 1.4% more in the first half of 2026URA.
HDB resale prices were flat to falling until 2019, then climbed: the resale index went from 131.5 (4Q 2019) to 203.6 (4Q 2025)HDB via SingStat, before easing to 202.8 in 2Q 2026HDB.
2015–16Prices fell 3.7% and 3.1% under the 2013 debt-servicing limit (TDSR) and stamp dutiesURA via SingStat.
2017–18Recovery with a collective-sale wave; prices rose 1.1% then 7.9%URA via SingStat.
2020–23Low rates, construction delays and HDB upgraders: +10.6% in 2021, +8.6% in 2022, +6.8% in 2023URA.
2024–26Cooling rounds, including 60% ABSD for foreign buyers from April 2023, slowed growth to 3.9% in 2024 and 3.3% in 2025URA via JLL.
Residential price indicesQ4 each year · 1Q 2009 = 100
Source: computed from URA PPI (SingStat), matching URA's published full-year changes
02 · 2005 to 2025
GDP grew faster than home prices. Per person, they moved together.
Over twenty years, Singapore's nominal GDP rose from S$212.7bn to S$789.5bn, 3.7 times or 6.8% a yearSingStat. The private price index rose from 84.5 to 216.4, 2.6 times or 4.8% a yearURA via data.gov.sg. So yes, the economy climbed well ahead of property.
Part of GDP's lead comes from more people: population rose 43%, from 4.27M to 6.11MSingStat. Divide GDP by population and output per person rose 2.59 times, from about S$49,900 to S$129,200. That is almost exactly the 2.56 times rise in home prices.
Home prices have kept pace with what each person produces, not run ahead of it. That is the strongest sign the long-run rise is backed by fundamentals.
Each card gives the evidence with its source, then how it can support prices. The link from evidence to prices is an economic interpretation; none of these guarantees that every home rises every year.
Median household market income rose 40.8% from 2015 to 2025, and 7.7% in 2025 alone (6.8% after inflation)SingStat KHIT 2025. More than half of households now earn at least S$12,000 a monthSingStat GHS 2025.
How it supports prices: Higher incomes raise the loan size buyers can service under TDSR and MSR limits, so price growth that tracks income is backed by real purchasing power.
Caveat: From 2025 SingStat measures 'market income', which adds investment and rental income to work income.
6.21Mtotal population, June 2026 (+1.6% in a year)NPTD 2026
2015 5.54M2026 6.21M
Up from 5.54M in 2015SingStat; the 2021 dip (grey bar) came from COVID border closures. In the year to June 2026, citizens grew 0.7% to 3.68M and non-residents 3.7% to 1.98MNPTD 2026.
How it supports prices: Every new resident household needs a home, and non-residents add to rental demand, which supports investor yields and prices.
Caveat: Recent non-resident growth is mostly Work Permit holders in construction, who largely live in dormitories.
How it supports prices: With the same population, smaller households mean more separate homes. This adds demand on top of population growth, and it is one reason DBS still expects rising prices despite 200k–300k new homes.
S$14.2bnfixed-asset investment committed to EDB, 2025EDB 2025 review
When realised over about five years, these commitments are expected to create 15,700 jobs, about two-thirds paying above S$5,000 a monthEDB 2025 review.
How it supports prices: Well-paid jobs support both owner-occupier purchases and rental demand from incoming professionals.
Caveat: These are commitments, not jobs already created.
Net inflows reached S$376bn in 2025, and 76% of assets are sourced from outside SingaporeMAS AM Survey 2025. More than 2,000 single family offices received tax incentives at end-2025MAS reply on SFOs.
How it supports prices: Finance creates jobs in banking, fund management, law and accounting. Professionals who relocate for them add rental demand and, where eligible, home purchases.
All of Singapore's housing, industry, defence, water catchment, airports and nature share 736.3 km². Reclamation targets 766 km² by 2030SG101, but each gain is slow and costlyURA Master Plan.
How it supports prices: Land is the largest part of a new condo's cost. Sites are sold by tender, so developers bid on expected selling prices, which sets a floor under new launches.
Caveat: The government controls most land and can raise supply through the Government Land Sales programme.
+42%BCA Tender Price Index, 2019 (99.9) to 2Q 2026 (141.9)BCA
Building a home now costs far more than before the pandemic, driven by materials, manpower and financing costs.
How it supports prices: Developers need higher selling prices to make new projects viable, which also makes existing homes look better value by comparison.
Caveat: Costs alone cannot force buyers to pay more.
76%trust the government, vs 50% globallyEdelman 2023
Singapore
76
Global avg
50
US
42
UK
37
Japan
33
Trust in government, % (28 countries surveyed)Edelman 2023
Singapore ranked fourth of 28 countries for trust in government in the 2023 Edelman Trust BarometerEdelman 2023. EDB cites political stability, low corruption and transparent institutions as foundations of Singapore's appeal to businessesEDB.
How it supports prices: Predictable rules give companies and families the confidence to commit capital and settle long-term, which supports long-horizon demand for homes.
Caveat: The link to housing demand is an economic inference.
Singapore ranked first in Gallup's 2025 Global Safety Report (2024 survey data), the 12th time it has topped the list; the global average is 73%Gallup 2025.
How it supports prices: A strong sense of safety shapes where parents choose to live and raise children, supporting Singapore's appeal as a long-term home.
Caveat: Measures perceived safety in general, not child safety specifically.
S$1 ≈ US$1DBS's 2040 outlook for the exchange rateDBS 2040
MAS manages the Singapore dollar against a trade-weighted basket of currencies to keep prices stableMAS. DBS expects it to reach parity with the US dollar by 2040DBS 2040.
How it supports prices: Confidence in the currency makes Singapore-dollar assets attractive to international investors as a store of value.
Caveat: A stronger dollar also makes homes dearer for buyers paid in other currencies, so the effect on demand is mixed.
491HDB resale flats sold at S$1M or more, 2Q 2026 (a record)Stacked Homes
The HDB resale index rose from 131.5 in 4Q 2019 to 203.6 in 4Q 2025HDB via SingStat. Owners who sell at these prices carry large gains and CPF refunds into private purchases.
How it supports prices: HDB price gains feed a pipeline of upgraders into mass-market condos, linking the two markets.
Caveat: HDB resale prices eased 0.1% and 0.3% in the first two quarters of 2026.
In Singapore 2040 (22 October 2025), DBS projects property prices growing at a long-term rate of 2–3% a year, even with 200,000–300,000 new homes builtDBS 2040. Move the slider to test other rates against your own home value.
S$
Example value. Enter your own.
Year
DBS 2%
2.5%
DBS 3%
2030
S$1.66M
S$1.70M
S$1.74M
2035
S$1.83M
S$1.92M
S$2.02M
2040
S$2.02M
S$2.17M
S$2.34M
Gain by 2040
+35%
+45%
+56%
Illustration only: a constant rate applied to one value. The 4.3% preset is the 2015–2025 average from the URA index. Actual prices move unevenly by segment, location and year.
Private price index: history and DBS range1Q 2009 = 100
EconomyUS$1.2–1.4tnNominal GDP by 2040, from US$547bn in 2024; real growth averaging 2.3% a yearDBS via Reuters
Supply200k–300k homesEstimated need by 2040, possibly up to 320k; Paya Lebar Air Base alone could yield about 150kDBS summary
CurrencyS$1 ≈ US$1DBS sees the Singapore dollar reaching parity with the US dollar by 2040DBS via Reuters
Price levelS$3,500–4,050 psfAverage private price by 2040, roughly double today, as reported from the DBS studyLianhe Zaobao
05 · Counterweights
What could slow the climb
The same data that supports a long-term rise also shows the limits. These are the forces most likely to flatten prices in a given year.
Supply
A large new-home pipeline
About 60,600 private homes, including ECs, were in the pipeline as of 2Q 2026, and the government is keeping Government Land Sales highURA. DBS expects 200k–300k homes by 2040DBS 2040.
Policy
Cooling measures
ABSD of 60% for foreign buyers, TDSR and loan limits keep price growth close to incomes. Each new round (2013, 2018, 2021, 2022, 2023) slowed the market, as the dips in section 01 showURA via SingStat.
Rates
Interest rates
Higher mortgage rates cut how much buyers can borrow. The 2022–23 rate rise slowed transactions even as prices kept rising.
Affordability
Prices ahead of incomes
Over 2015–2025, private prices rose 52.8%URA via SingStat against 40.8% for median household incomeSingStat KHIT 2025. If that gap widens again, demand weakens.
Cycle
Economic shocks
DBS notes past downturns brought price falls of 20–40%EdgeProp. A global recession or job losses would test the income and employment drivers.
Demography
An ageing society
21.4% of citizens were 65 or older in June 2026NPTD 2026, and the resident fertility rate fell to a record-low 0.87 in 2025SingStat. Long-run demand leans on immigration policy.
Signal
HDB resale is cooling
The HDB resale index fell 0.1% and 0.3% in 1Q and 2Q 2026, its first back-to-back drop since 2019, as more flats reached their minimum occupation periodHDBStacked Homes.
The bottom line
Over twenty years, private home prices rose 2.56 times while GDP per person rose 2.59 timessection 02. Incomes are up 36.8% since 2020SingStat KHIT 2025, the population has reached 6.21 million on 736 km² of landNPTD 2026, households keep shrinking, and fund inflows hit a recordMAS AM Survey 2025. DBS turns that into 2–3% a year to 2040DBS 2040, below the 4.3% a year of the last decade. The main brakes are deliberate: steady government land supply and cooling measures designed to keep prices in line with incomes.
I'd like to measure which articles are actually useful, using Google Analytics and a Meta advertising pixel. Nothing is loaded until you choose, and declining costs you nothing on this site. What these do.